Ceramic tiles are being used worldwide. That’s why world production and consumption of ceramic tiles or vitrified tiles are huge. There are so many ceramic tiles Manufacturers, ceramic tiles Exporter, ceramic tiles Importer, and ceramic tiles Consumption countries.
Table of Contents
Top 10 Ceramic Tiles Manufacturer
1 China
2014 – 6000 Sq.m Mill
2015 – 5970 Sq.m Mill
2016 – 6495 Sq.m Mill
2017 – 6400 Sq.m Mill
2018 – 5684 Sq.m Mill
2019 – 5187 Sq.m Mill
China produced the world’s 40.9% ceramic tiles, vitrified tiles, and porcelain tiles in 2019.
2 India
2014 – 825 Sq.m Mill
2015 – 850 Sq.m Mill
2016 – 955 Sq.m Mill
2017 – 1080 Sq.m Mill
2018 – 1145 Sq.m Mill
2019 – 1266 Sq.m Mill
India produced the world’s 10.0% ceramic tiles, vitrified tiles, and porcelain tiles in 2019.
3 Brazil
2014 – 903 Sq.m Mill
2015 – 886 Sq.m Mill
2016 – 871 Sq.m Mill
2017 – 867 Sq.m Mill
2018 – 872 Sq.m Mill
2019 – 909 Sq.m Mill
Brazil produced the world’s 7.2% ceramic tiles, vitrified tiles, and porcelain tiles in 2019.
4 Vietnam
2014 – 360 Sq.m Mill
2015 – 440 Sq.m Mill
2016 – 485 Sq.m Mill
2017 – 560 Sq.m Mill
2018 – 602 Sq.m Mill
2019 – 560 Sq.m Mill
Vietnam produced a world’s 4.4% ceramic tiles, vitrified tiles, and porcelain tiles in 2019.
5 Spain
2014 – 425 Sq.m Mill
2015 – 440 Sq.m Mill
2016 – 492 Sq.m Mill
2017 – 530 Sq.m Mill
2018 – 530 Sq.m Mill
2019 – 510 Sq.m Mill
Spain produced the world’s 4.0% ceramic tiles, vitrified tiles, and porcelain tiles in 2019.
6 Italy
2014 – 382 Sq.m Mill
2015 – 395 Sq.m Mill
2016 – 416 Sq.m Mill
2017 – 422 Sq.m Mill
2018 – 416 Sq.m Mill
2019 – 401 Sq.m Mill
Italy produced the world’s 3.2% ceramic tiles, vitrified tiles, and porcelain tiles in 2019.
7 Iran
2014 – 410 Sq.m Mill
2015 – 300 Sq.m Mill
2016 – 340 Sq.m Mill
2017 – 373 Sq.m Mill
2018 – 383 Sq.m Mill
2019 – 398 Sq.m Mill
Iran produced the world’s 3.1% ceramic tiles, vitrified tiles, and porcelain tiles in 2019.
8 Indonesia
2014 – 420 Sq.m Mill
2015 – 370 Sq.m Mill
2016 – 360 Sq.m Mill
2017 – 307 Sq.m Mill
2018 – 383 Sq.m Mill
2019 – 347 Sq.m Mill
Indonesia produced the world’s 2.7% ceramic tiles, vitrified tiles, and porcelain tiles in 2019.
9 Egypt
2014 – 220 Sq.m Mill
2015 – 230 Sq.m Mill
2016 – 250 Sq.m Mill
2017 – 300 Sq.m Mill
2018 – 300 Sq.m Mill
2019 – 300 Sq.m Mill
Egypt produced the world’s 2.4% ceramic tiles, vitrified tiles, and porcelain tiles in 2019.
10 Turkey
2014 – 315 Sq.m Mill
2015 – 320 Sq.m Mill
2016 – 330 Sq.m Mill
2017 – 355 Sq.m Mill
2018 – 335 Sq.m Mill
2019 – 296 Sq.m Mill
Turkey produced the world’s 2.3% ceramic tiles, vitrified tiles, and porcelain tiles in 2019.
Top 10 Ceramic Tiles Exporter
1 China
2015 – 1089 Sq.m Mill
2016 – 1025 Sq.m Mill
2017 – 908 Sq.m Mill
2018 – 854 Sq.m Mill
China exported the world’s 31.1% ceramic tiles, vitrified tiles, and porcelain tiles in 2018.
2 Spain
2015 – 378 Sq.m Mill
2016 – 395 Sq.m Mill
2017 – 407 Sq.m Mill
2018 – 414 Sq.m Mill
Spain exported a world’s 15.1% ceramic tiles, vitrified tiles, and porcelain tiles in 2018.
3 Italy
2015 – 316 Sq.m Mill
2016 – 332 Sq.m Mill
2017 – 338 Sq.m Mill
2018 – 328 Sq.m Mill
Italy exported a world’s 11.9% ceramic tiles, vitrified tiles, and porcelain tiles in 2018.
4 India
2015 – 134 Sq.m Mill
2016 – 186 Sq.m Mill
2017 – 228 Sq.m Mill
2018 – 274 Sq.m Mill
India exported the world’s 10.0% ceramic tiles, vitrified tiles, and porcelain tiles in 2018.
5 Iran
2015 – 112 Sq.m Mill
2016 – 126 Sq.m Mill
2017 – 148 Sq.m Mill
2018 – 151 Sq.m Mill
Iran exported the world’s 5.5% ceramic tiles, vitrified tiles, and porcelain tiles in 2018.
6 Brazil
2015 – 77 Sq.m Mill
2016 – 94 Sq.m Mill
2017 – 90 Sq.m Mill
2018 – 100 Sq.m Mill
Brazil exported a world’s 3.6% ceramic tiles, vitrified tiles, and porcelain tiles in 2018.
7 Turkey
2015 – 77 Sq.m Mill
2016 – 81 Sq.m Mill
2017 – 93 Sq.m Mill
2018 – 100 Sq.m Mill
Turkey exported the world’s 3.6% ceramic tiles, vitrified tiles, and porcelain tiles in 2018.
8 Mexico
2015 – 61 Sq.m Mill
2016 – 56 Sq.m Mill
2017 – 53 Sq.m Mill
2018 – 46 Sq.m Mill
Mexico exported a world’s 1.7% ceramic tiles, vitrified tiles, and porcelain tiles in 2018.
9 Poland
2015 – 42 Sq.m Mill
2016 – 46 Sq.m Mill
2017 – 45 Sq.m Mill
2018 – 43 Sq.m Mill
Poland exported the world’s 1.6% ceramic tiles, vitrified tiles, and porcelain tiles in 2018.
10 United Arab Emirates (UAE)
2015 – 54 Sq.m Mill
2016 – 48 Sq.m Mill
2017 – 46 Sq.m Mill
2018 – 42 Sq.m Mill
United Arab Emirates (UAE) exported the world’s 1.5% ceramic tiles, vitrified tiles, and porcelain tiles in 2018.
Top 10 Ceramic Tiles Importer
1 United States of America (USA)
2014 – 164 Sq.m Mill
2015 – 179 Sq.m Mill
2016 – 194 Sq.m Mill
2017 – 202 Sq.m Mill
2018 – 209 Sq.m Mill
United States of America (USA) imported the world’s 7.6% ceramic tiles, vitrified tiles, and porcelain tiles in 2018.
2 Iraq
2014 – 102 Sq.m Mill
2015 – 106 Sq.m Mill
2016 – 112 Sq.m Mill
2017 – 129 Sq.m Mill
2018 – 124 Sq.m Mill
Iraq imported the world’s 4.5% ceramic tiles, vitrified tiles, and porcelain tiles in 2018.
3 Saudi Arabia
2014 – 165 Sq.m Mill
2015 – 188 Sq.m Mill
2016 – 167 Sq.m Mill
2017 – 131 Sq.m Mill
2018 – 113 Sq.m Mill
Saudi Arabia imported the world’s 4.1% ceramic tiles, vitrified tiles, and porcelain tiles in 2018.
4 France
2014 – 99 Sq.m Mill
2015 – 99 Sq.m Mill
2016 – 104 Sq.m Mill
2017 – 112 Sq.m Mill
2018 – 108 Sq.m Mill
France imported the world’s 3.9% ceramic tiles, vitrified tiles, and porcelain tiles in 2018.
5 Germany
2014 – 95 Sq.m Mill
2015 – 100 Sq.m Mill
2016 – 115 Sq.m Mill
2017 – 109 Sq.m Mill
2018 – 106 Sq.m Mill
Germany imported a world’s 3.9% ceramic tiles, vitrified tiles and porcelain tiles in 2018.
6 Philippines
2014 – 53 Sq.m Mill
2015 – 60 Sq.m Mill
2016 – 75 Sq.m Mill
2017 – 82 Sq.m Mill
2018 – 91 Sq.m Mill
The Philippines imported a world’s 3.3% ceramic tiles, vitrified tiles, and porcelain tiles in 2018.
7 Indonesia
2014 – 46 Sq.m Mill
2015 – 45 Sq.m Mill
2016 – 57 Sq.m Mill
2017 – 64 Sq.m Mill
2018 – 77 Sq.m Mill
Indonesia imported a world’s 2.8% ceramic tiles, vitrified tiles, and porcelain tiles in 2018.
8 South Korea
2014 – 76 Sq.m Mill
2015 – 72 Sq.m Mill
2016 – 75 Sq.m Mill
2017 – 78 Sq.m Mill
2018 – 77 Sq.m Mill
South Korea imported the world’s 2.8% ceramic tiles, vitrified tiles, and porcelain tiles in 2018.
9 Israel
2014 – 44 Sq.m Mill
2015 – 52 Sq.m Mill
2016 – 57 Sq.m Mill
2017 – 58 Sq.m Mill
2018 – 61 Sq.m Mill
Israel imported a world’s 2.2% ceramic tiles, vitrified tiles, and porcelain tiles in 2018.
10 Thailand
2014 – 49 Sq.m Mill
2015 – 56 Sq.m Mill
2016 – 54 Sq.m Mill
2017 – 55 Sq.m Mill
2018 – 57 Sq.m Mill
Thailand imported the world’s 2.1% ceramic tiles, vitrified tiles, and porcelain tiles in 2018.
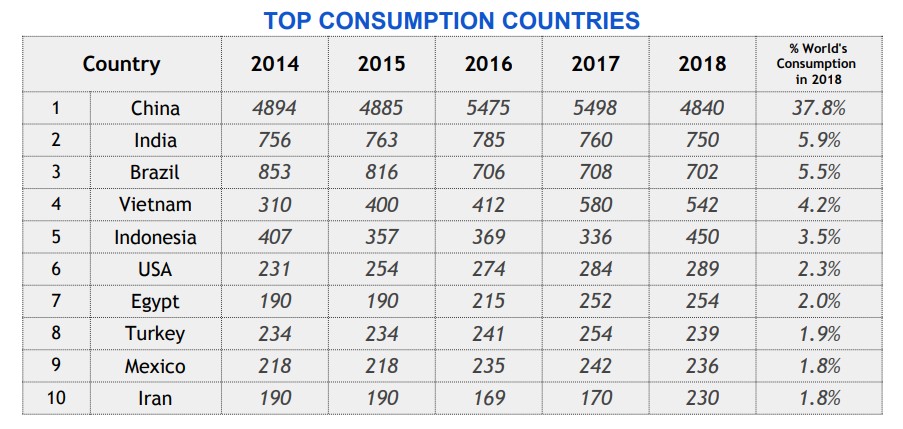
Top 10 Ceramic Tiles Consumption Countries
1 China
2014 – 4894 Sq.m Mill
2015 – 4885 Sq.m Mill
2016 – 5475 Sq.m Mill
2017 – 5498 Sq.m Mill
2018 – 4840 Sq.m Mill
China consumed the world’s 37.8% ceramic tiles, vitrified tiles, and porcelain tiles in 2018.
2 India
2014 – 756 Sq.m Mill
2015 – 763 Sq.m Mill
2016 – 785 Sq.m Mill
2017 – 760 Sq.m Mill
2018 – 750 Sq.m Mill
India consumed the world’s 5.9% ceramic tiles, vitrified tiles, and porcelain tiles in 2018.
3 Brazil
2014 – 853 Sq.m Mill
2015 – 816 Sq.m Mill
2016 – 706 Sq.m Mill
2017 – 708 Sq.m Mill
2018 – 702 Sq.m Mill
Brazil consumed the world’s 5.5% ceramic tiles, vitrified tiles, and porcelain tiles in 2018.
4 Vietnam
2014 – 310 Sq.m Mill
2015 – 400 Sq.m Mill
2016 – 412 Sq.m Mill
2017 – 580 Sq.m Mill
2018 – 542 Sq.m Mill
Vietnam consumed the world’s 4.2% ceramic tiles, vitrified tiles, and porcelain tiles in 2018.
5 Indonesia
2014 – 407 Sq.m Mill
2015 – 357 Sq.m Mill
2016 – 369 Sq.m Mill
2017 – 336 Sq.m Mill
2018 – 450 Sq.m Mill
Indonesia consumed the world’s 3.5% ceramic tiles, vitrified tiles, and porcelain tiles in 2018.
6 United States of America (USA)
2014 – 231 Sq.m Mill
2015 – 254 Sq.m Mill
2016 – 274 Sq.m Mill
2017 – 284 Sq.m Mill
2018 – 289 Sq.m Mill
United States of America (USA) consumed the world’s 2.3% ceramic tiles, vitrified tiles, and porcelain tiles in 2018.
7 Egypt
2014 – 190 Sq.m Mill
2015 – 190 Sq.m Mill
2016 – 215 Sq.m Mill
2017 – 252 Sq.m Mill
2018 – 254 Sq.m Mill
Egypt consumed the world’s 2.0% ceramic tiles, vitrified tiles, and porcelain tiles in 2018.
8 Turkey
2014 – 215 Sq.m Mill
2015 – 234 Sq.m Mill
2016 – 241 Sq.m Mill
2017 – 254 Sq.m Mill
2018 – 239 Sq.m Mill
Turkey consumed the world’s 1.9% ceramic tiles, vitrified tiles, and porcelain tiles in 2018.
9 Mexico
2014 – 197 Sq.m Mill
2015 – 218 Sq.m Mill
2016 – 235 Sq.m Mill
2017 – 242 Sq.m Mill
2018 – 236 Sq.m Mill
Mexico consumed the world’s 1.8% ceramic tiles, vitrified tiles, and porcelain tiles in 2018.
10 Iran
2014 – 280 Sq.m Mill
2015 – 190 Sq.m Mill
2016 – 169 Sq.m Mill
2017 – 170 Sq.m Mill
2018 – 230 Sq.m Mill
Iran consumed the world’s 1.8% ceramic tiles, vitrified tiles, and porcelain tiles in 2018.
Above all date has been taken from the Ceramic world review. You can find out lots of figures and facts about the ceramic world.
Also, Read What are Ceramic tiles
Update on 20 January 2021